Excel Data Preparation
- Organising datasets
- Handling missing values and inconsistencies
- Preparing data for analysis
QRIUSAI GLOBAL INTERNSHIP
Excel for Business Analytics Internship
Build practical Excel skills to prepare data, analyse business performance, uncover trends and create clear reports that support better business decisions.
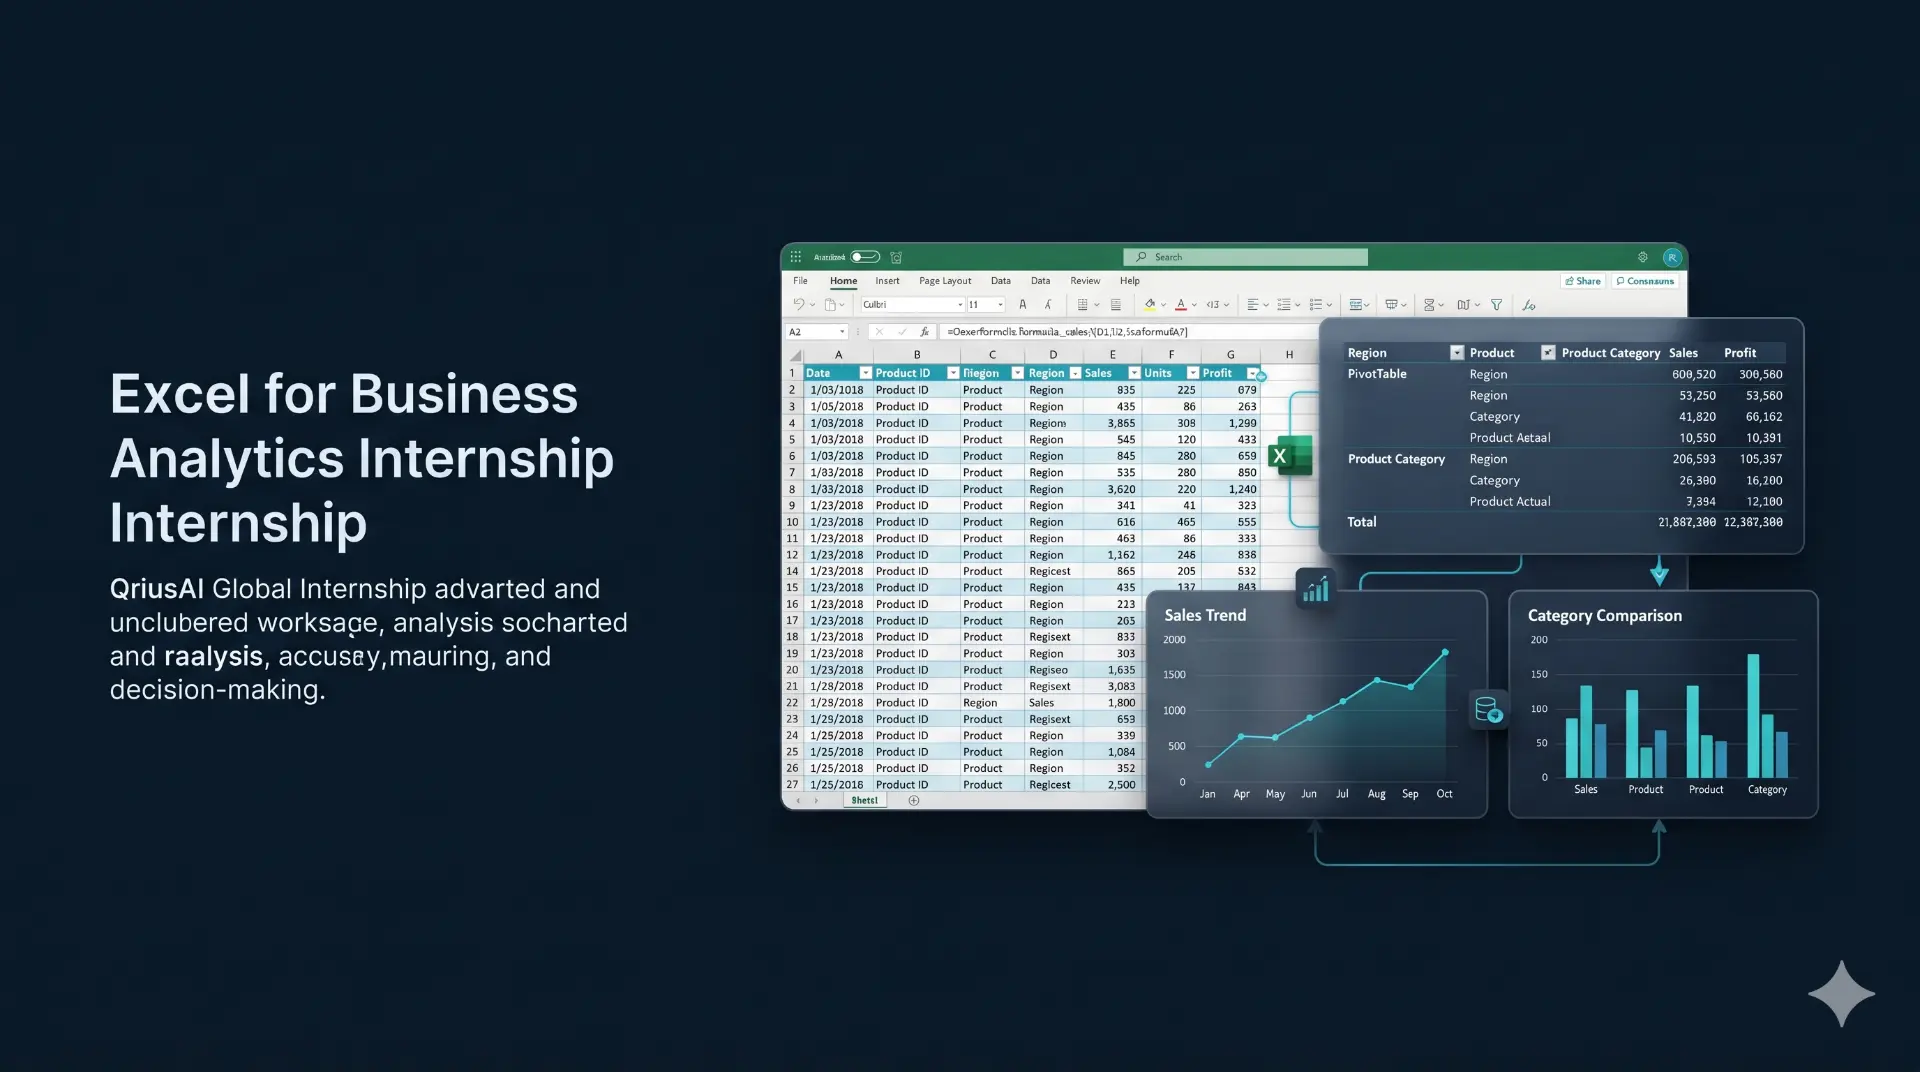
LEARNING AREAS
Proposed learning areas that move from clean data to clear business recommendations.
THE LEARNING JOURNEY
A structured path from a business question to a decision-ready report.
A practical, mentor-guided experience applying Excel to real business questions.
Clarify the business question and the data needed to answer it.
Organise, clean and structure the dataset for analysis.
Use formulas, lookups and PivotTables to find patterns.
Build clear charts and summary reports.
Present findings and evidence-based recommendations.
PRACTICAL BUSINESS APPLICATION
Apply spreadsheet analysis to business questions, uncover trends and communicate findings through clear, decision-ready reports.
Business contexts are examples; project assignments may vary by cohort.
INTENDED LEARNING OUTCOMES
These are the skills the program is designed to build. They are learning outcomes, not employment guarantees.
NEXT COHORT
Submitting the application form starts your application. The QriusAI team will contact you with the next steps.
Apply NowApplications are reviewed before onboarding.